A printed star chart shows the night sky for a given month on paper, so you can use it outdoors without a battery, screen or signal. Universe Today reports that Skymaps.com publishes a new printable chart each month for both the Northern and Southern hemispheres. Each release includes a monthly sky calendar and a list of objects to see with binoculars, a telescope or the naked eye, so one page covers both planning and observing.
Why use a printable star chart?
No battery or screen in the field
A printed chart needs no charging, no software update and no mobile signal. You can hold it on a clipboard, mark it with a pencil and keep using it when a phone battery runs low. Cost depends on the publisher, so check the download page of the specific release before you print it.
Monthly calendar of events and sky highlights
Each monthly release includes a sky calendar. Read the month’s dated events and sky highlights before your session, then compare them with the weather forecast for your location to choose a night.
Object lists for naked eye, binoculars and telescopes
The object list is sorted by equipment, which lets you match targets to what you are carrying:
- Naked eye: Start with the entries you can find without optics, using the constellation outlines on the chart to orient yourself.
- Binoculars: Work through the entries marked for binoculars once you have located their constellations.
- Telescope: Use the telescope entries after you have identified their region of sky on the chart, so you can point the instrument without searching blind.
Working through the three groups in this order means each night builds from easy targets to optically demanding ones.
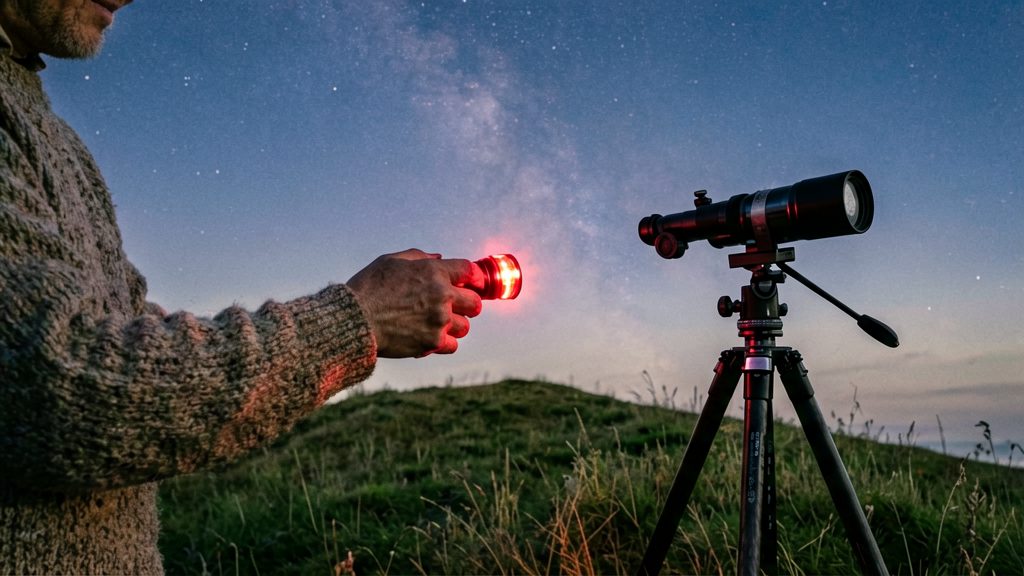
Which printable charts suit Canadian skies?
Two printable options are named by Universe Today: the National Research Council of Canada (NRC) and Skymaps.com. Their current prices and download availability were not checked, so confirm them on each publisher’s site. Canada lies entirely in the Northern Hemisphere, so the Northern Hemisphere editions are the relevant ones. The two charts differ in what they show, so choose by the observing task you have in mind.
| Chart | Publisher | Format | What it shows |
|---|---|---|---|
| Planisphere (online and printable) | National Research Council of Canada | Set to the current month; printable version available | Constellations visible on a given night; brightest stars only |
| Monthly sky chart (Northern Hemisphere) | Skymaps.com | New printable chart each month | Monthly sky calendar and a list of objects to see with binoculars, a telescope or the naked eye |
NRC planisphere
According to Universe Today, the NRC offers an online planisphere and a printable version. Its planisphere format suits quick identification of constellations for a given night.
Skymaps.com monthly charts
Skymaps.com’s monthly release is the more useful choice if you want a planned observing session rather than only a star-identification tool.
Unconfirmed listings (not recommended)
The following charts appeared only in search results. Their pages could not be read, so their content, coverage and availability are unverified. Do not rely on them until you check them yourself:
- Sky & Telescope’s free Getting Started chart
- A 50°N planisphere described as suitable for Canada
- Celestron SkyMaps, listed at 39 CAD
- The Ontario Science Centre/SkyNews chart. A claim that it is based on the RASC Observer’s Handbook comes from an unofficial Scribd copy and has not been confirmed.
- A Martz Observatory PDF whose content could not be read, so its latitude and usage details are unknown
How do you read a Northern Hemisphere star chart?
A Northern Hemisphere star chart is a flat picture of the sky as seen overhead, so reading it means matching its layout to the real sky. Start by orienting the printout so that the top edge points north, then use the star brightness symbols to find the stars you can realistically see, and use the coordinate grid to pin down the exact position of any object. The steps below cover these three skills in that order.
Orienting a north-up printout
Most printable charts for the Northern Hemisphere are drawn with north at the top. To use one:
- Hold the chart above your head or lay it flat on the ground, with the top edge pointing north.
- Remember that the chart is a view of the sky, not a map of the ground. East appears on the left and west on the right, the reverse of a paper map.
- The area near the top edge is close to the north celestial pole, so stars there appear to circle the sky without setting.
| Chart edge | Compass direction | Practical check |
|---|---|---|
| Top | North | Stars close to the pole, near this edge, can stay above the horizon all night |
| Bottom | South | Objects here lie toward the southern sky and reach their highest point there when they cross the meridian |
| Left | East | Risen objects appear here first |
| Right | West | Setting objects move toward this side |
Star magnitude symbols and brightness scale
Charts show brightness in two ways: dot size and magnitude numbers.
- Magnitude: a lower number means a brighter star. Stars with higher numbers are fainter.
- Dot size: larger dots usually mark brighter stars, so the chart gives a quick visual ranking before you read any numbers.
- Labels: star names and constellation lines vary between publishers, so check the legend of your chart.
A printed chart shows only the brightest stars in a simplified way. For fainter objects, check the magnitude scale printed in the chart legend, because symbol styles differ between publishers.
Right ascension and declination grid lines
Many charts include a coordinate grid, and the two sets of lines do different jobs.
- Declination (Dec): lines parallel to the celestial equator, which sits midway between the poles. Declination measures how far an object lies north or south of that line, in degrees.
- Right ascension (RA): lines running from pole to pole, labelled in hours. RA increases toward the east, so it works like a sky longitude.
Planisphere or monthly chart: which is better?
A planisphere and a printed monthly chart answer different questions. A planisphere tells you which constellations are up at a given time on a given date, while a seasonal atlas shows more detail, including fainter stars. For a quick check of what is overhead tonight, the planisphere is faster. For learning the sky region by region, the atlas gives more detail.
Planisphere wheel: setting the month and time window
A planisphere has a rotating disc and a fixed window. You turn the disc until the current month is aligned with the current time, and the window then shows the constellations visible that night.
The limitation is detail. A planisphere shows only the brightest stars, so faint stars and fine structure in constellations are missing. It works well for orientation and for identifying the main patterns, but it does not show enough to navigate between smaller stars.
Seasonal atlas: choose a region, then use reference stars
A seasonal star atlas is a set of charts, each covering a part of the sky. You open it to the region you want, find a few reference stars that you recognise, and explore outward from there. This method takes more practice than reading a planisphere, but it reveals fainter stars that a wheel cannot show.
Comparison at a glance
| Format | How you set it | Detail | Best for |
|---|---|---|---|
| Planisphere | Turn the wheel to the month and time | Brightest stars only | Identifying constellations on a given night |
| Monthly printed chart | Pick the month’s sheet | Monthly sky calendar and object list (Skymaps.com) | Planning which part of the sky to observe that month |
| Seasonal atlas | Open to the region you want | Fainter stars, detailed regions | Star-hopping and finding fainter targets |
Does your latitude change the chart?
Yes. Your latitude fixes the angle of the sky’s rotation axis above your horizon, which determines which stars stay up all night and how the whole star field is tilted on a chart. A chart drawn for one latitude matches the sky best for observers near that latitude.
How pole altitude follows latitude
For a Northern Hemisphere observer, the north celestial pole sits above the northern horizon at an altitude equal to your latitude in degrees. Observing farther north raises the pole; observing farther south lowers it toward the horizon. Because the stars appear to turn around this point, the pole altitude sets the tilt of the star field you see.
Which circumpolar stars never set
Circumpolar stars never set for a given observer. A star qualifies when its angular distance from the pole is smaller than your latitude, so it keeps circling above the horizon. As latitude decreases, fewer stars qualify, and more constellations rise and set through the night. To check a chart, find the pole on its edge, then compare the circumpolar region marked on the map with the stars you can see from your site.
Generating a monthly map from latitude and longitude
Some tools build the map from your coordinates instead of a fixed latitude. According to Universe Today, the TAU Astronomy Club generates a monthly sky map for any location once you enter its latitude and longitude.
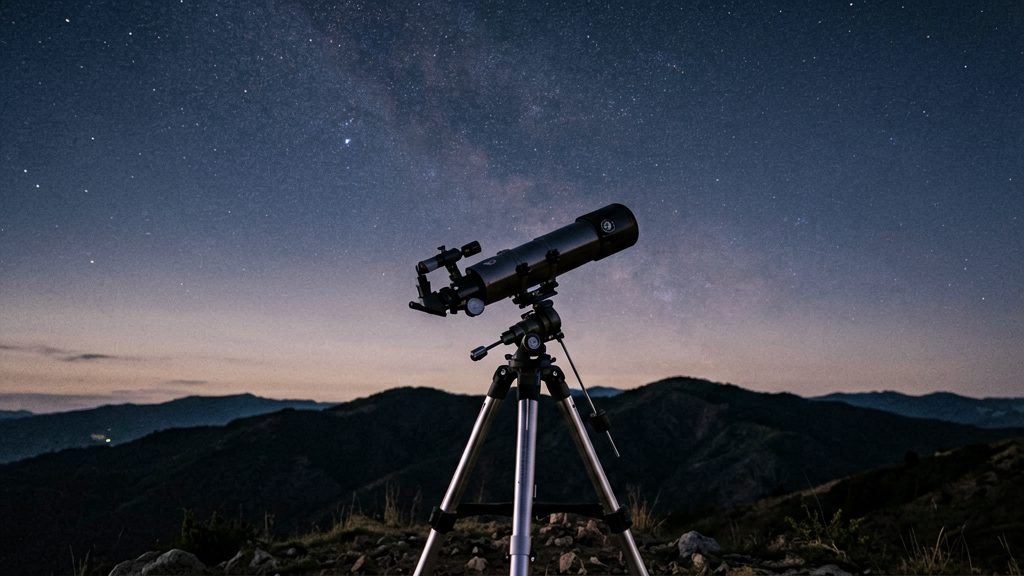
How do you use a chart in the dark?
Reading a printed chart while observing depends on keeping your eyes dark-adapted, so your lighting, timing and paper handling matter as much as the chart itself. Set up the chart indoors, use dim red light outdoors, and protect the paper from wind and moisture before you start matching stars.
Lighting with red light
- Red light is the standard choice because it preserves dark-adapted night vision better than white light does.
- Use a red LED or a flashlight with a red filter. Point it at the chart, not at your face, and keep it at the lowest brightness that lets you read the printout.
- Read the chart indoors before going out, so you spend little time under light outside.
Giving your eyes time to adjust
Dark adaptation is gradual. Your eyes keep gaining sensitivity the longer you stay in darkness, so faint stars and deep-sky targets are easier to see after a longer stay. Plan a first stretch outdoors for matching bright constellations, and save fainter targets for later in the session.
Keeping the printout flat and dry
- Mount the printout on a rigid clipboard so it lies flat when a breeze gets up.
- Hold the corners with clips or small weights. Loose sheets lift easily in wind.
- Dew wets paper and can smear ink. Slip the chart into a clear plastic sleeve between uses, and keep a spare printout in your bag.
Using a planisphere or star atlas outside
For a seasonal star atlas, open it to the region of sky you want, find a few reference stars, and explore outward from them.
Pair your printout with an app or binoculars
A fixed monthly printout shows the sky for a given month and location, not the exact sky above you tonight. Combining it with a star app and binoculars lets you move from bright, recognisable stars to faint targets and confirm each identification before you observe. Each tool covers a different part of the job.
| Tool | Role in this workflow | Limitation |
|---|---|---|
| Planisphere | Shows the constellations visible on a given night once the wheel is set to the current month | Shows only the brightest stars |
| Seasonal star atlas | Open it to the region you want, then identify a few reference stars and explore from there | Works best with stars you can already recognise |
| Star app | Shows the sky for your location and time, so you can check positions against the printout | Depends on correct time and location settings |
Star-hopping from chart landmarks to binocular targets
Star-hopping means moving from a star you can see with the naked eye to a fainter target through a sequence of nearby stars. The method:
- Find a bright reference star or an easily recognised pattern in the sky.
- Locate the same star on the printout and note its labelled neighbours.
- Trace the path on the chart between that star and your target, then sweep the binoculars along it, pausing at each intermediate star to confirm your position.
If the target is not where the chart suggests, return to the last star you positively identified and start the hop again. Do not sweep blindly across the sky.
Cross-checking the printout against a star app
Set the app to your location and the current time, then compare its constellation outlines with the printout. If the two disagree, check these first:
- Date: a planisphere or chart set to another month shows different stars in the same position.
- Orientation: hold the printout so that the compass directions match the sky, then compare.
- Location: make sure the app and the chart are set for the same observing site.
Use the app to resolve any mismatch rather than assuming either source is wrong.
Matching chart labels to binocular field of view
Once your binoculars are on a reference star, compare the labelled neighbours on the printout with what appears in the field of view. Match the pattern of relative positions and relative brightness, not absolute counts. Confirm a target by its position relative to two or three labelled stars. The field of view figure for your binoculars is listed in the manufacturer’s specifications; check it so you know how much of the chart a single view covers.