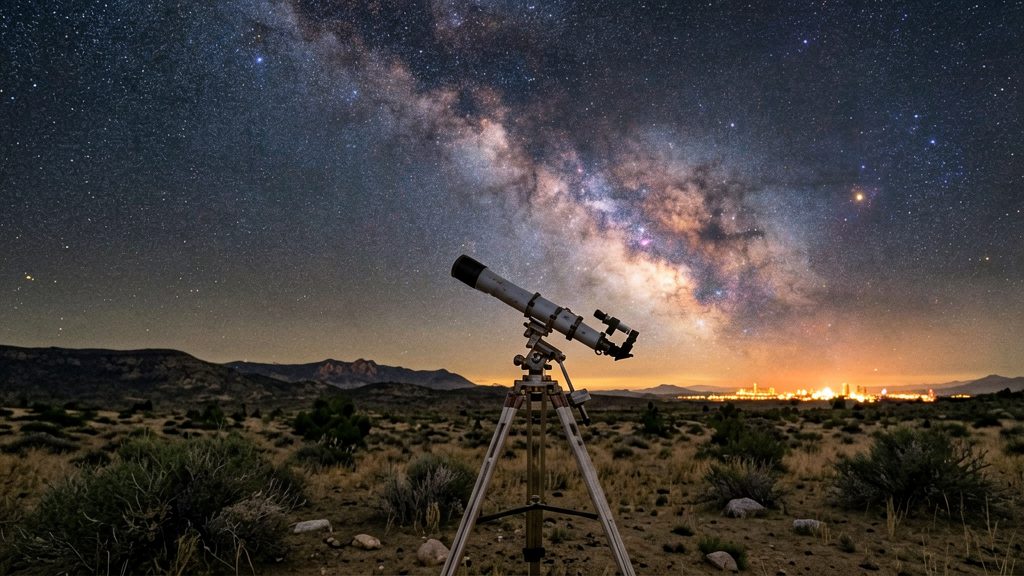
Light pollution maps show how dark the sky is likely to be at a given spot, so you can choose an observing site before you drive there. They combine satellite night-light data with modeled sky-brightness values, which lets you compare a home, a county park and a remote site from one screen. Planning this way tells you in advance which targets are realistic from a location, so a long drive is less likely to end with a washed-out sky.
Why a light pollution map matters for stargazing
How maps reveal sky darkness before you travel
Several U.S. map tools are available, and they use different data. Go-Astronomy (2026) describes two views: a 2023 nighttime-lights satellite image, interactive on Blue Marble Navigator, and a 2015 Bortle/SQM-based map on LightPollutionMap.info. LightPollutionMap.app (2026) derives its values from modeled SQM sky brightness in mag/arcsec² and builds its 2025 annual layer from NOAA VIIRS annual night-light data.
| Tool | Data basis | Planning use |
|---|---|---|
| Dark Sky Map (darkskymap.com) | Color-coded sky brightness, searchable by hometown | Quick check of a home town and nearby parks |
| Blue Marble Navigator | 2023 nighttime-lights satellite image | Shows where artificial light is concentrated |
| LightPollutionMap.info | 2015 Bortle/SQM-based map | Compares sky-brightness classes across regions |
| LightPollutionMap.app | Modeled SQM, 2025 annual layer from NOAA VIIRS | Estimates sky brightness for a specific spot |
On the Dark Sky Map, dark blue or black marks the darkest skies and white or light pink marks the most washed-out. Mental Floss (2025) suggests Crater Lake (OR) and Great Basin (NV) as stargazing destinations.
What sky brightness changes at the eyepiece
- Naked-eye limiting magnitude: The faintest star you can see without optics depends on local sky brightness. Under urban glow only the brightest stars remain. Under darker skies many more appear. The map shows which situation to expect, but your own eyesight and conditions set the exact limit.
- Faint Milky Way and deep-sky visibility: The Milky Way’s fainter structure appears only where the background is dark. Choosing an observing site that the map shows in the darkest colors is the first filter for seeing it.
- Contrast loss on diffuse nebulae: Extended objects such as nebulae and galaxies lose contrast first as sky glow brightens. Compact targets like double stars generally hold up better from brighter sites than diffuse nebulae do.
Using the map to plan a session
- Enter your home area or a candidate site and note whether it falls in the darkest colors.
- Compare the sky-brightness view with the satellite nighttime-lights image to see whether the dark area is close to you or far away.
- Check the publication year of each layer. The 2015 map is older than the 2023 image and the 2025 annual layer.
- Pick targets to match the site: diffuse objects for dark areas, compact targets for brighter ones.
Which light pollution maps are available for the US?
Three free web tools cover most US light pollution checks, and each one answers a different question. LightPollutionMap.app gives modeled sky brightness with Bortle and SQM layers, Dark Sky Map gives a color-coded brightness check for a hometown, and Go-Astronomy links two US views, a 2015 Bortle/SQM map and a 2023 nighttime-lights image. Pick the tool that matches your question before you compare results.
| Tool | Main output | Best use |
|---|---|---|
| LightPollutionMap.app | Modeled SQM and Bortle layers | Estimating sky brightness for a specific place |
| Dark Sky Map (darkskymap.com) | Color-coded sky brightness after a hometown search | Quick visual check of nearby skies |
| Go-Astronomy U.S. maps | 2015 Bortle/SQM map and 2023 nighttime-lights satellite image | Comparing an older sky-brightness model with recent satellite light data |
LightPollutionMap.app
This is the most detailed option for numeric estimates. Its Bortle values are a quantitative interpretation of modeled SQM sky brightness in mag/arcsec², not a traditional field classification.
- Use the layer type to match your question. The SQM layer gives the modeled brightness value, and the Bortle layer gives a class derived from it.
Dark Sky Map
Dark Sky Map (darkskymap.com) is the fastest option for a first look. You search a hometown and the map shows sky brightness in color. Dark blue or black marks the darkest skies, and white or light pink marks the most washed-out areas, according to Mental Floss (2025). The map gives a visual ranking rather than a numeric SQM value, so use it to decide which direction or region to explore, then check details elsewhere.
Go-Astronomy U.S. maps
Go-Astronomy’s page offers two different US views, which makes it useful for comparison:
- 2015 Bortle/SQM-based map, interactive on LightPollutionMap.info. Its age makes it a historical baseline rather than a current picture.
- 2023 nighttime-lights satellite image, interactive on Blue Marble Navigator. It shows where artificial light is visible from orbit, not sky brightness at the ground.
The page also lists US dark sky sites by state and by Bortle class, according to Go-Astronomy (2026). Use the two map views together as a cross-check, remembering that they measure different things and date from different years, so agreement does not guarantee a dark sky on a given night.
How do you read Bortle and SQM values?
Bortle and SQM describe the same thing, sky darkness, in different forms. The Bortle scale is a class label; it is commonly described as running from 1 (darkest) to 9 (brightest), though this range was not confirmed against a primary source for this article. SQM is a measured sky brightness in magnitudes per square arcsecond (mag/arcsec²), where a higher number means a darker sky. On LightPollutionMap.app, the Bortle value is a quantitative interpretation derived from modeled SQM sky brightness, not a traditional field classification, so the two are linked but not interchangeable.
What a Bortle class tells you on the map
- Colour legend: map colours correspond to classes. Check the legend on the page you are using, because colour schemes vary between tools.
What an SQM value tells you
- Higher mag/arcsec² means darker sky. Compare numbers in the same unit only; a reading from a different meter or app is not directly comparable.
- Modeled versus measured: a map SQM value is an estimate for a grid area. A handheld meter reports the brightness at one point in the sky you aim it at.
Taking a reading with a handheld sky quality meter
- Wait until your eyes are adapted to the dark and move away from streetlights and your home’s exterior lights.
- Point the meter straight up at the zenith, keeping it away from any light source in view.
- Take several readings, average them, and note the date, time and cloud cover.
- Read the manufacturer’s instructions for the meter’s exact operating procedure and any calibration steps. For example, the Unihedron Sky Quality Meter is a widely used model; check its documentation for current guidance.
| Source | What it reports | Main limitation |
|---|---|---|
| Handheld SQM meter | Measured brightness at one aimed point | Reflects only the point measured; sensitive to nearby light |
What do satellite-based maps get wrong?
Satellite-based light pollution maps show modeled sky brightness, not conditions measured at your observing site on a given night. The LightPollutionMap.app sky-brightness view is a clear-sky approximation, and its Bortle values are not on-site measurements. Four factors explain most of the gap between the map and the sky you see: atmospheric conditions, local obstructions, short-term lights, and data that is not real-time.
Atmosphere: clouds, haze and moisture
The model assumes a clear sky. It does not account for clouds, haze, or moisture in the air. These particles scatter artificial light back toward the ground, so a site that the map rates as dark can look brighter on a humid or hazy night.
Local obstructions: buildings and trees
Buildings and trees are not included in the model. A nearby light source can be blocked by a tree line or a building wall, which makes the sky darker in that direction than the map suggests. The reverse also holds: a site with no obstruction gets the full glow from a nearby source. Look at the horizon in every direction at dusk to see which sources are shielded and which are not.
Temporary and non-real-time lights
The maps do not show temporary lights, such as construction lighting, events, or short-term outdoor installations. They also do not update in real time. The 2025 annual layer summarises a year rather than the specific night you plan to observe.
Photo-based SQM estimates
The photo-based SQM estimate on LightPollutionMap.app carries roughly ±1–2 Bortle error. Treat that output as a rough guide, not a precise reading. A meter measurement at your observing spot gives a direct check for that point and night, though it is a single-point sample.
Does a DarkSky certification mean Bortle 1?
No. Being DarkSky-certified does not guarantee a specific Bortle value. Certified sites can differ: according to Go-Astronomy (2026), one certified site may be Bortle 1 and another Bortle 3. The certification and the Bortle number answer different questions, so check the Bortle value for the exact site you plan to visit rather than assuming it from the certificate.
Why certification and Bortle value diverge
- Certification is a formal recognition of a site’s dark-sky program, not a single brightness reading.
- Bortle value describes sky brightness at a location. A certified site can sit at Bortle 1 or Bortle 3, so the two labels are not interchangeable.
Why many dark locations are uncertified
Certification can take 2–3 years, according to Go-Astronomy (2026). Many genuinely dark locations have not yet completed that process. A site without a certificate is therefore not necessarily brighter than a certified one.
Which US places are suggested for dark skies?
The US locations named in the reference material are Crater Lake in Oregon, Great Basin in Nevada, and Teton County in Wyoming. Crater Lake and Great Basin are listed as suggested stargazing parks, and Teton County was named the first International Dark Sky county. The sources give no sky-brightness value for any of them, so treat these places as starting points and check conditions for the specific site and night you plan to use.
| Location | Designation named in source | Source |
|---|---|---|
| Crater Lake, Oregon | Suggested stargazing park | Mental Floss (2025-07-07) |
| Great Basin, Nevada | Suggested stargazing park | Mental Floss (2025-07-07) |
| Teton County, Wyoming | First International Dark Sky county | Mental Floss (2025-07-07) |
Crater Lake, Oregon
Crater Lake is a national park in Oregon and is one of two parks that Mental Floss (2025-07-07) suggests for stargazing. Visitors should confirm the current park rules for night access and any evening programs with the park before travelling.
Great Basin, Nevada
Great Basin is the second park on the same suggested list. Its sky quality is not given in the reference material, so compare the site on a light pollution map before choosing a night.
Teton County, Wyoming
Teton County was named the first International Dark Sky county. The same source notes that Jackson Hole Airport was named the world’s first Dark Sky airport. Because a county includes towns, valleys and open ground, sky brightness may differ from one observing spot to another.
Before you go
- Use a sky app to confirm the Moon’s phase and rise time, since moonlight reduces faint-object contrast.
- Visit the specific observing spot in advance, and plan a route that avoids nearby town lights where possible.
Pair your map with clear-sky forecasts and a moon calendar
A light pollution map shows the background sky you can expect on a clear night, but it cannot tell you whether tonight is clear. Combine it with a cloud and transparency forecast for your observing window and with the Moon’s phase and rise and set times. Each input answers a different question, and a session works best when all three are favourable.
| Input | What it tells you | What it misses |
|---|---|---|
| Cloud and transparency forecast | Whether the sky will be open, and how clear the air is, for your hours | Background sky brightness |
| Moon phase and rise/set times | How much moonlight will brighten the sky, and when | Clouds and local light sources |
Check cloud cover and transparency for the observing window
Check the forecast for the hours you plan to observe, not only the evening average. Cloud cover shows whether the sky is open at all. Transparency describes how clear the air is, which determines how faint a target you can see. Haze can wash out a site that the map rates as dark, so a dark location with poor transparency may perform like a brighter one.
Time the Moon against faint targets
Moonlight raises the sky background, so a bright Moon affects faint deep-sky objects such as galaxies and diffuse nebulae the most. Bright planets, the Moon itself and wide double stars are much less sensitive to moonlight. Check the phase, then the moonrise and moonset times for your date. If the Moon sets well before the hours you plan to observe, the faint-object window is open. If it is up for most of the night, schedule faint targets for another night and use the Moon-friendly targets instead.
Checklist before you leave
- Open the map and note the site’s Bortle estimate as an approximation.
- Check cloud cover and transparency for the planned observing window.
- Check the Moon’s phase and rise and set times.
- Choose targets that suit the moonlight: faint objects after moonset, bright targets during moonlight.
- If conditions differ from the forecast, switch to a brighter target or a different night rather than forcing a faint-object session.